GULF SHORE BOULEVARD
SECOND QUARTER MARKET REPORT
FOR 2014
This Gulf Shore Blvd Naples FL Real Estate Report is brought to you by Dustin Beard. Sales volume and prices continue to increase with inventory decreasing in both the beach and bay front markets. If you are looking for a good time to enter the market, now is that time. Sellers can capitalize on the lack of inventory while buyers can get in on an appreciating market. If you are considering purchasing or selling a home in Naples, call Dustin.
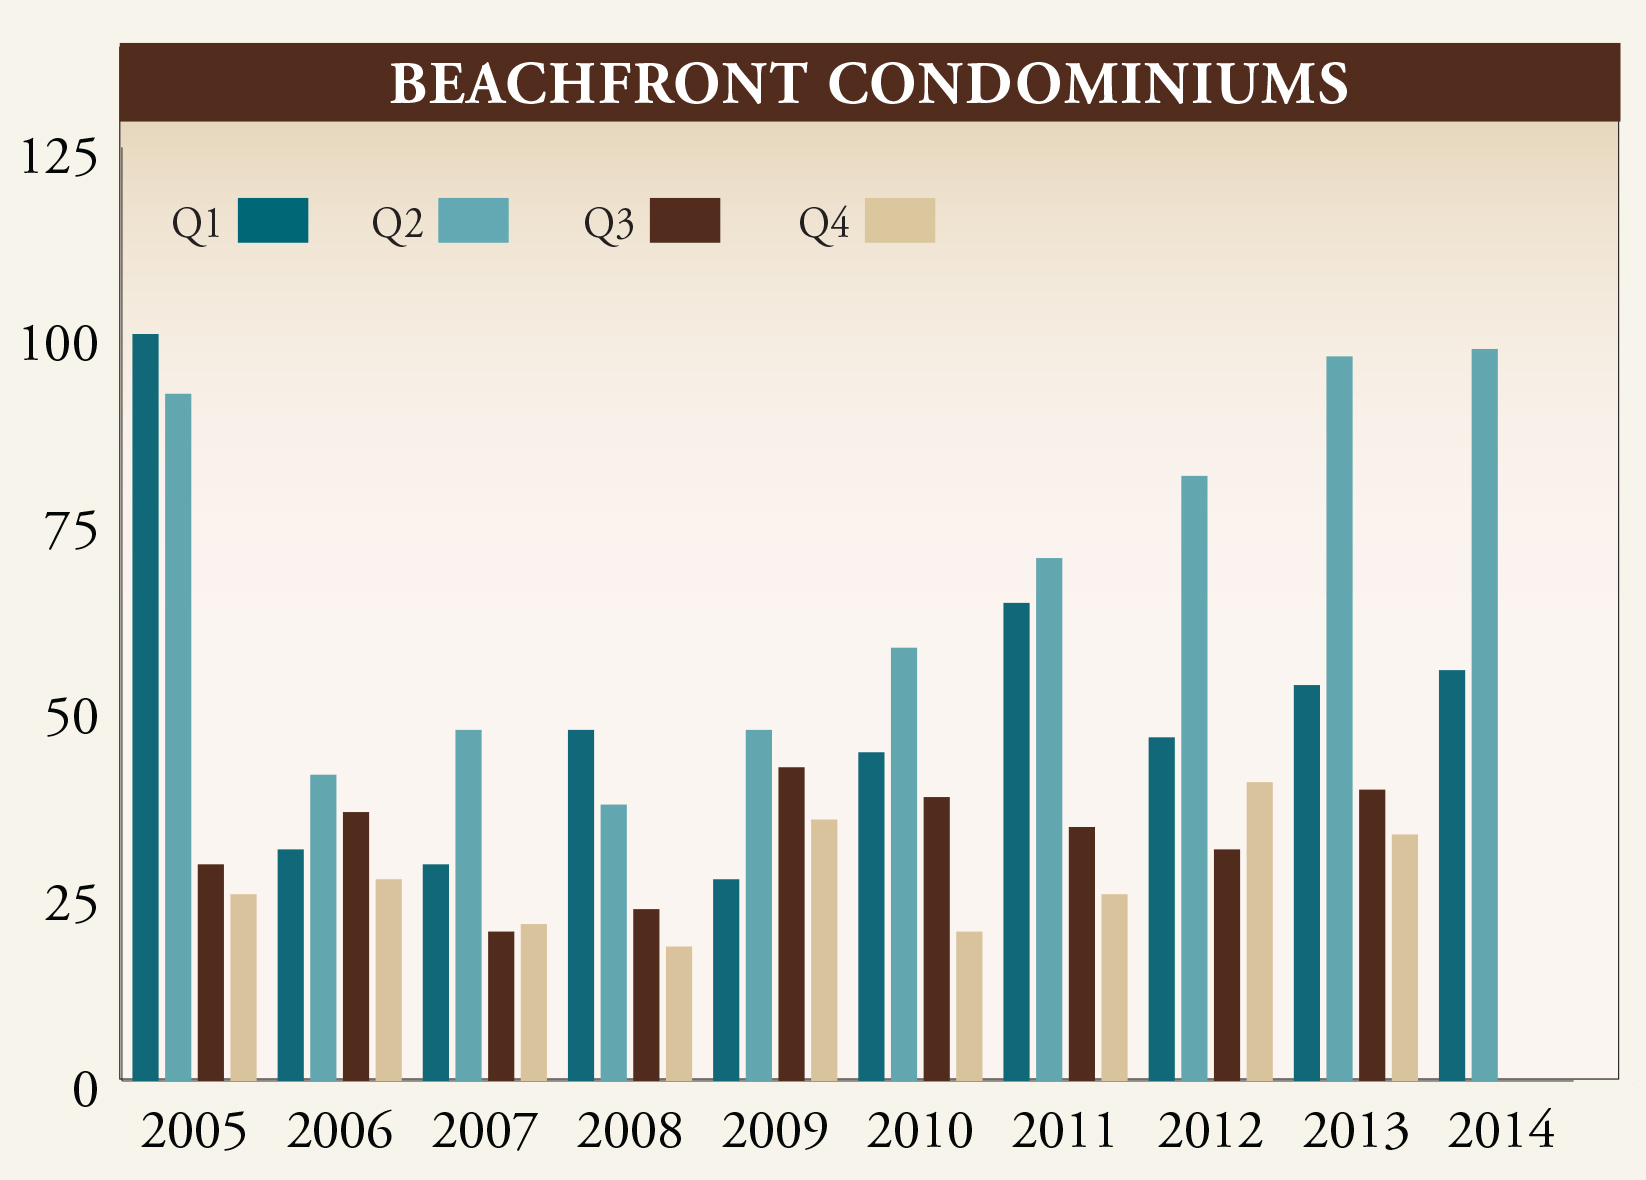
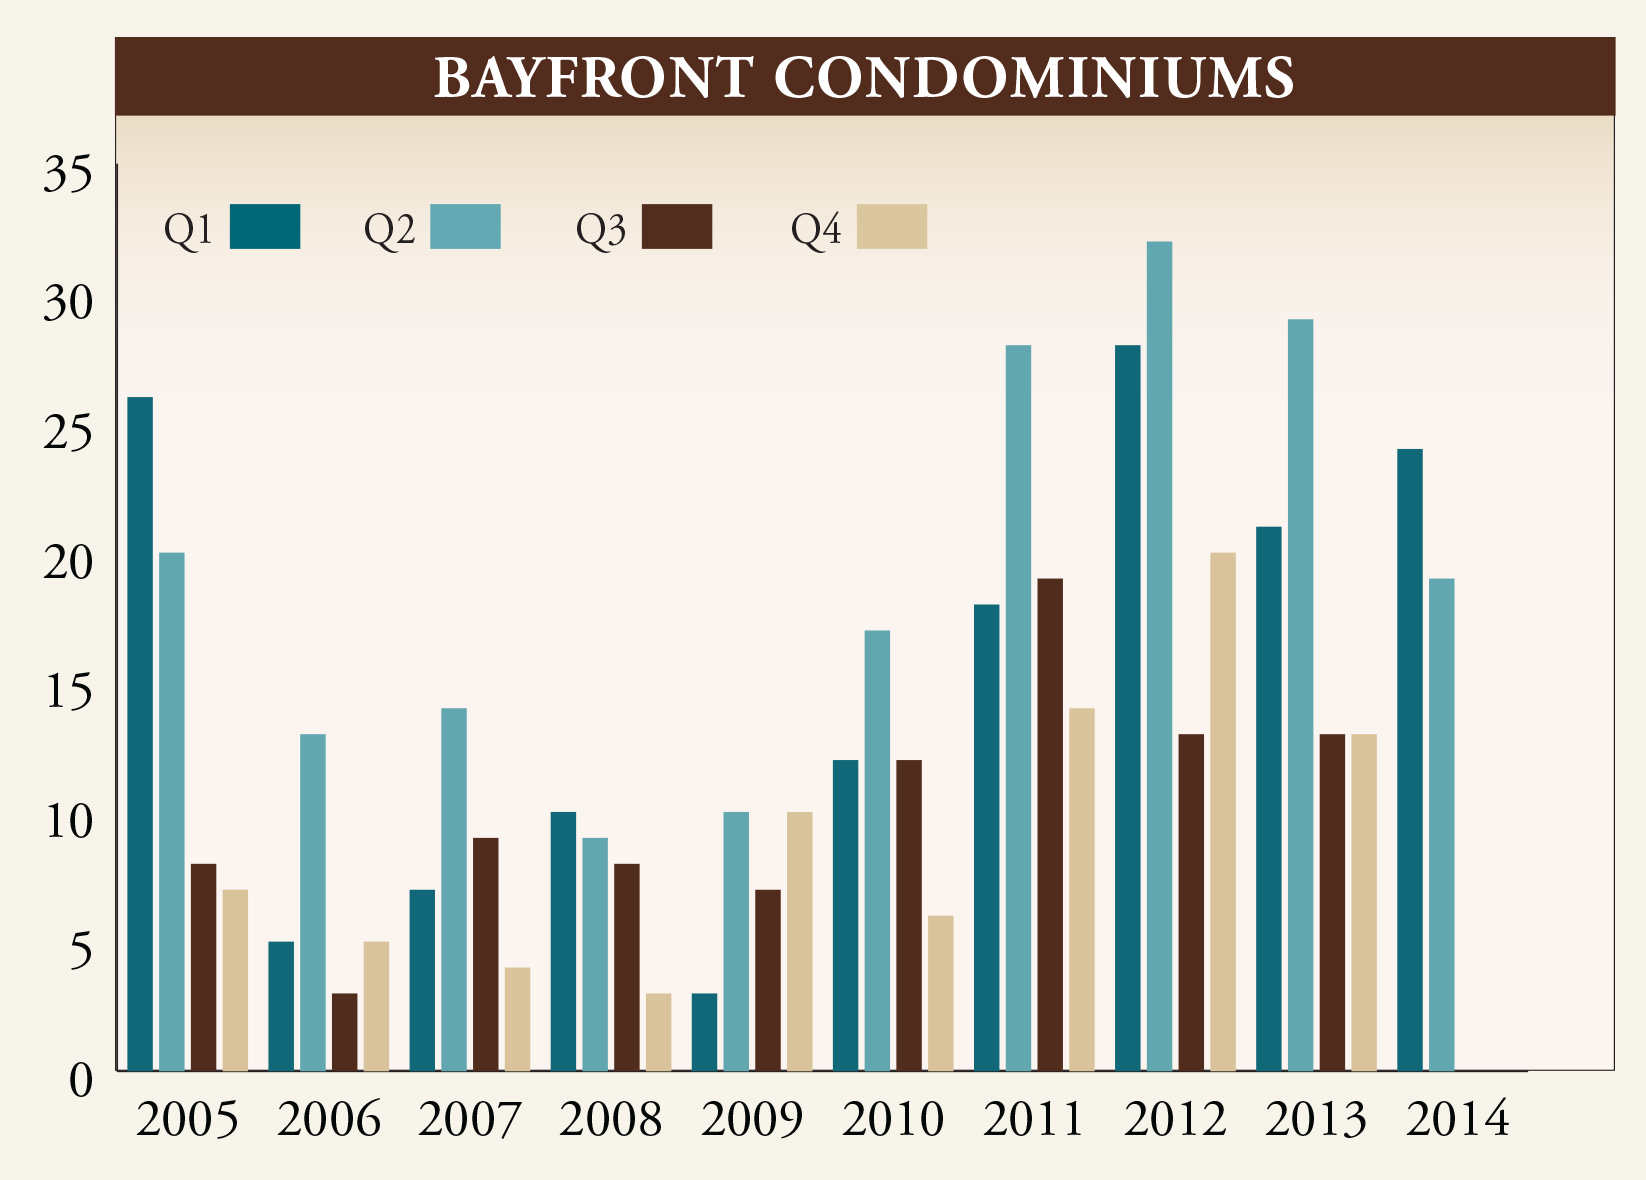
QUARTERLY NUMBER OF CLOSED SALES
Second quarter beachfront sales reached their highest level for the period since 2005 but remained approximately the same as Q2 2013. Buildings with the highest number of sales were Terraces with nine, followed by Admiralty Point I, Provence and Surfsedge with five sales in each building. (Exhibit 1a)
The number of sales on the bayfront declined 37% during the quarter with 19 sales, down from 30 in 2013. Limited inventory was the major factor in the decrease. Highest activity on the bay occurred at Charleston Square and Madrid Club with three sales each. (Exhibit 1b)
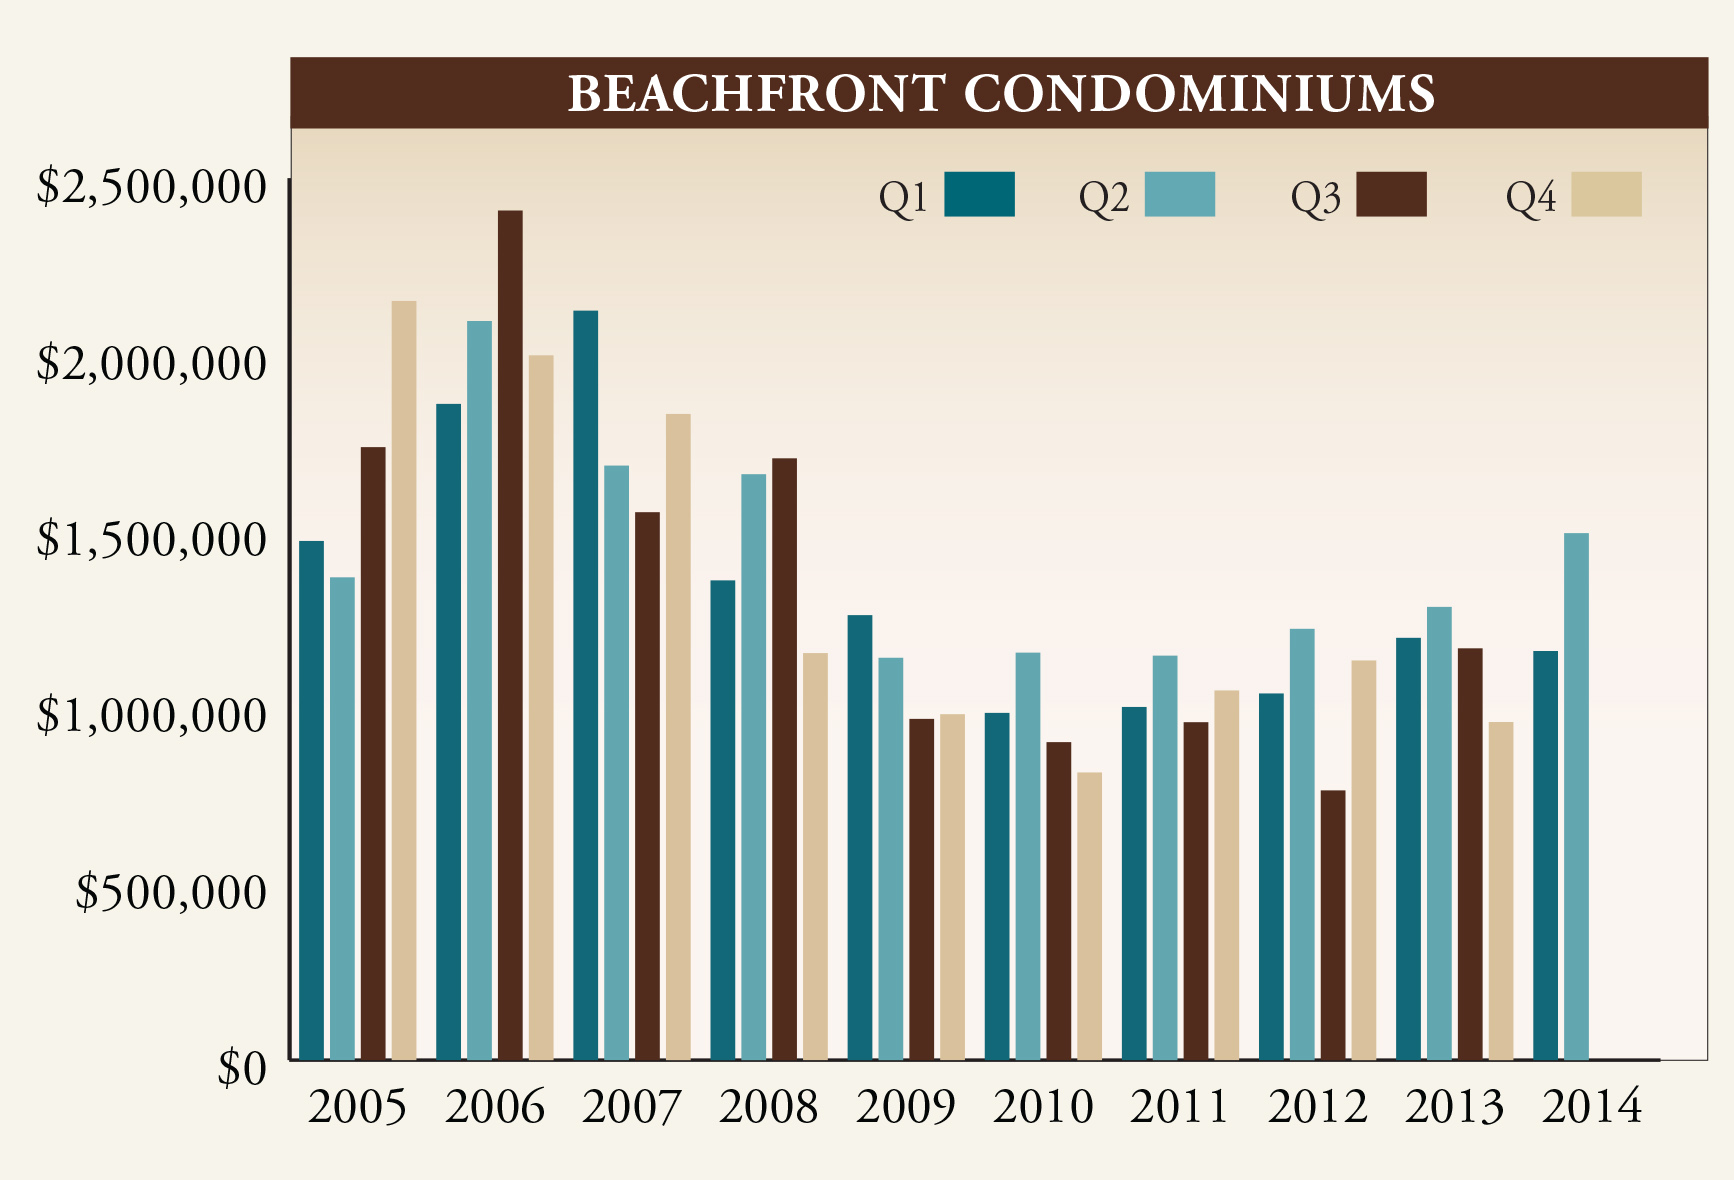
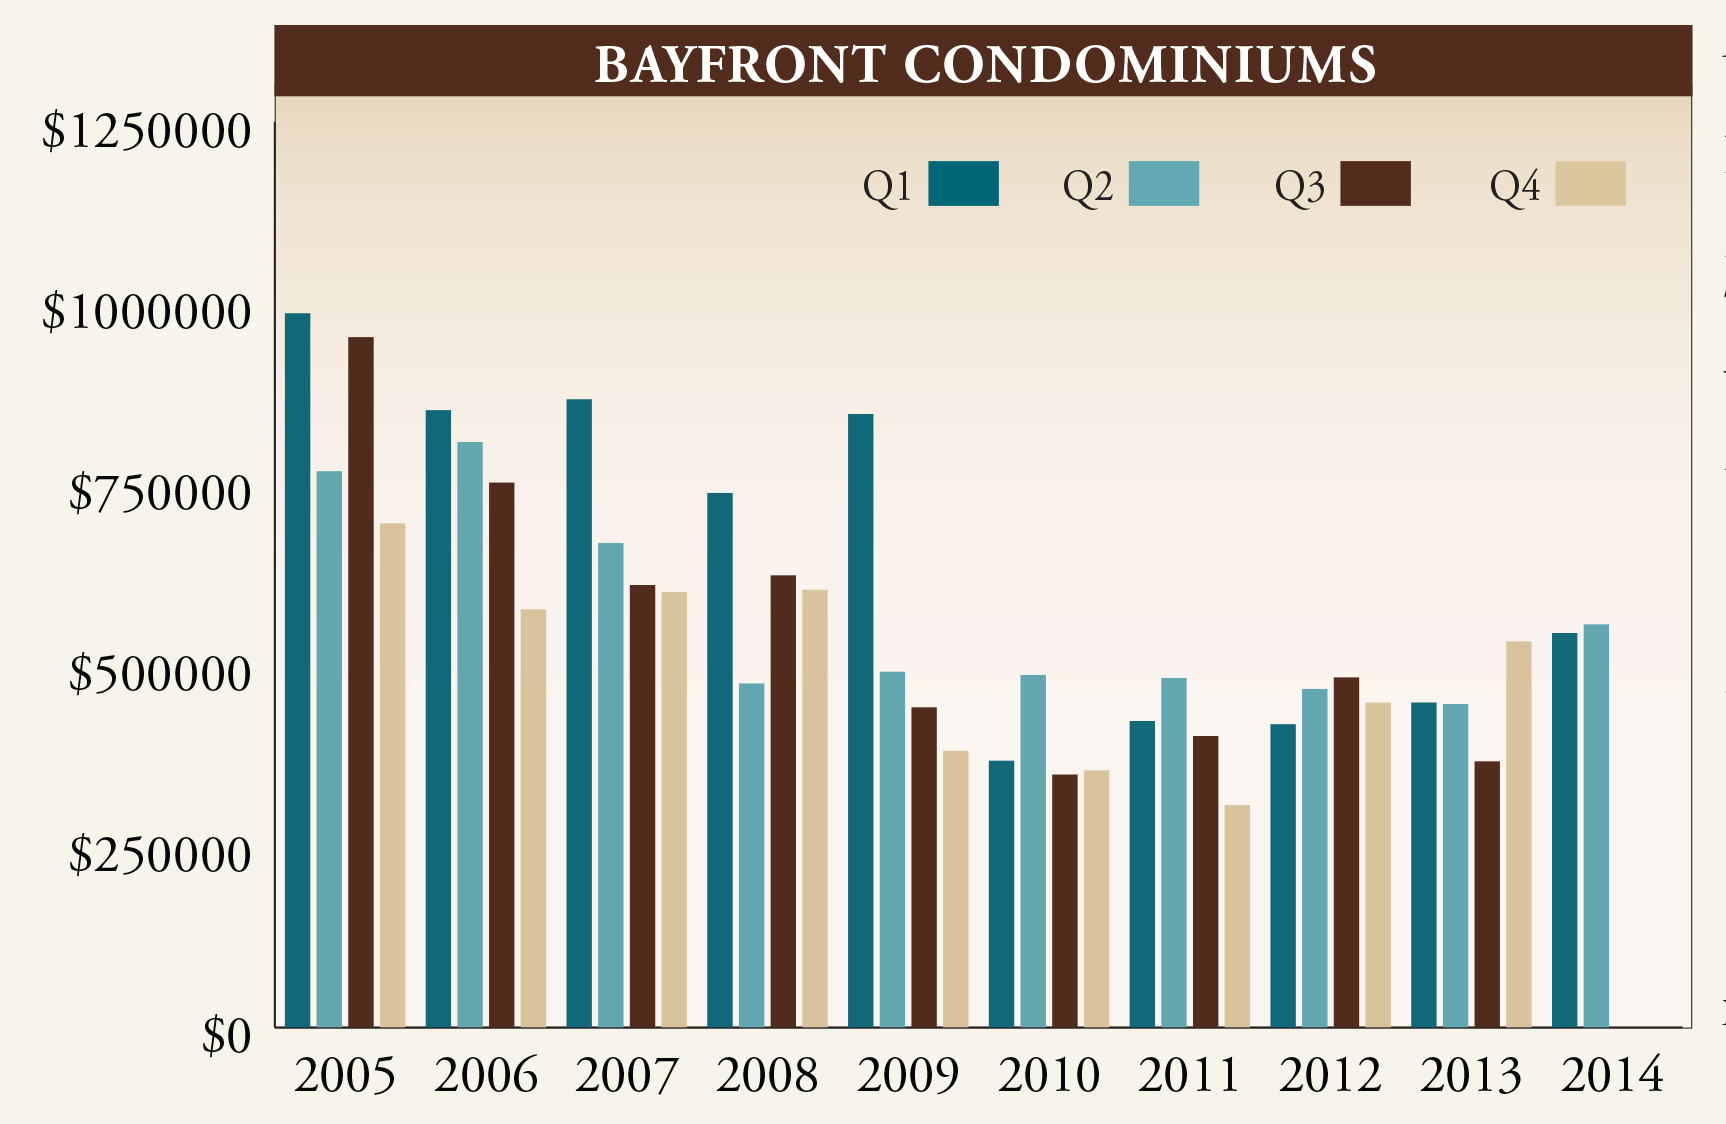
QUARTERLY AVERAGE SALES PRICE – CLOSED SALES
Average sale price of closed properties on the beach during Q2 2014 was $1,493,657, a 16% increase from Q2 2013. Average price was impacted by a number of high end sales, notably, two in Le Rivage and four in Regent. (Exhibit 2a)
Average sale price of closed properties on the bay during the quarter was $556,284, a 26% increase from Q2 2013. The bayfront condominiums with the highest average sales price during the quarter were Charleston Square (three sales averaging $1,125,000), Tropics (one sale / $985,000) and Boulevard Club (one sale / $610,000). (Exhibit 2b)
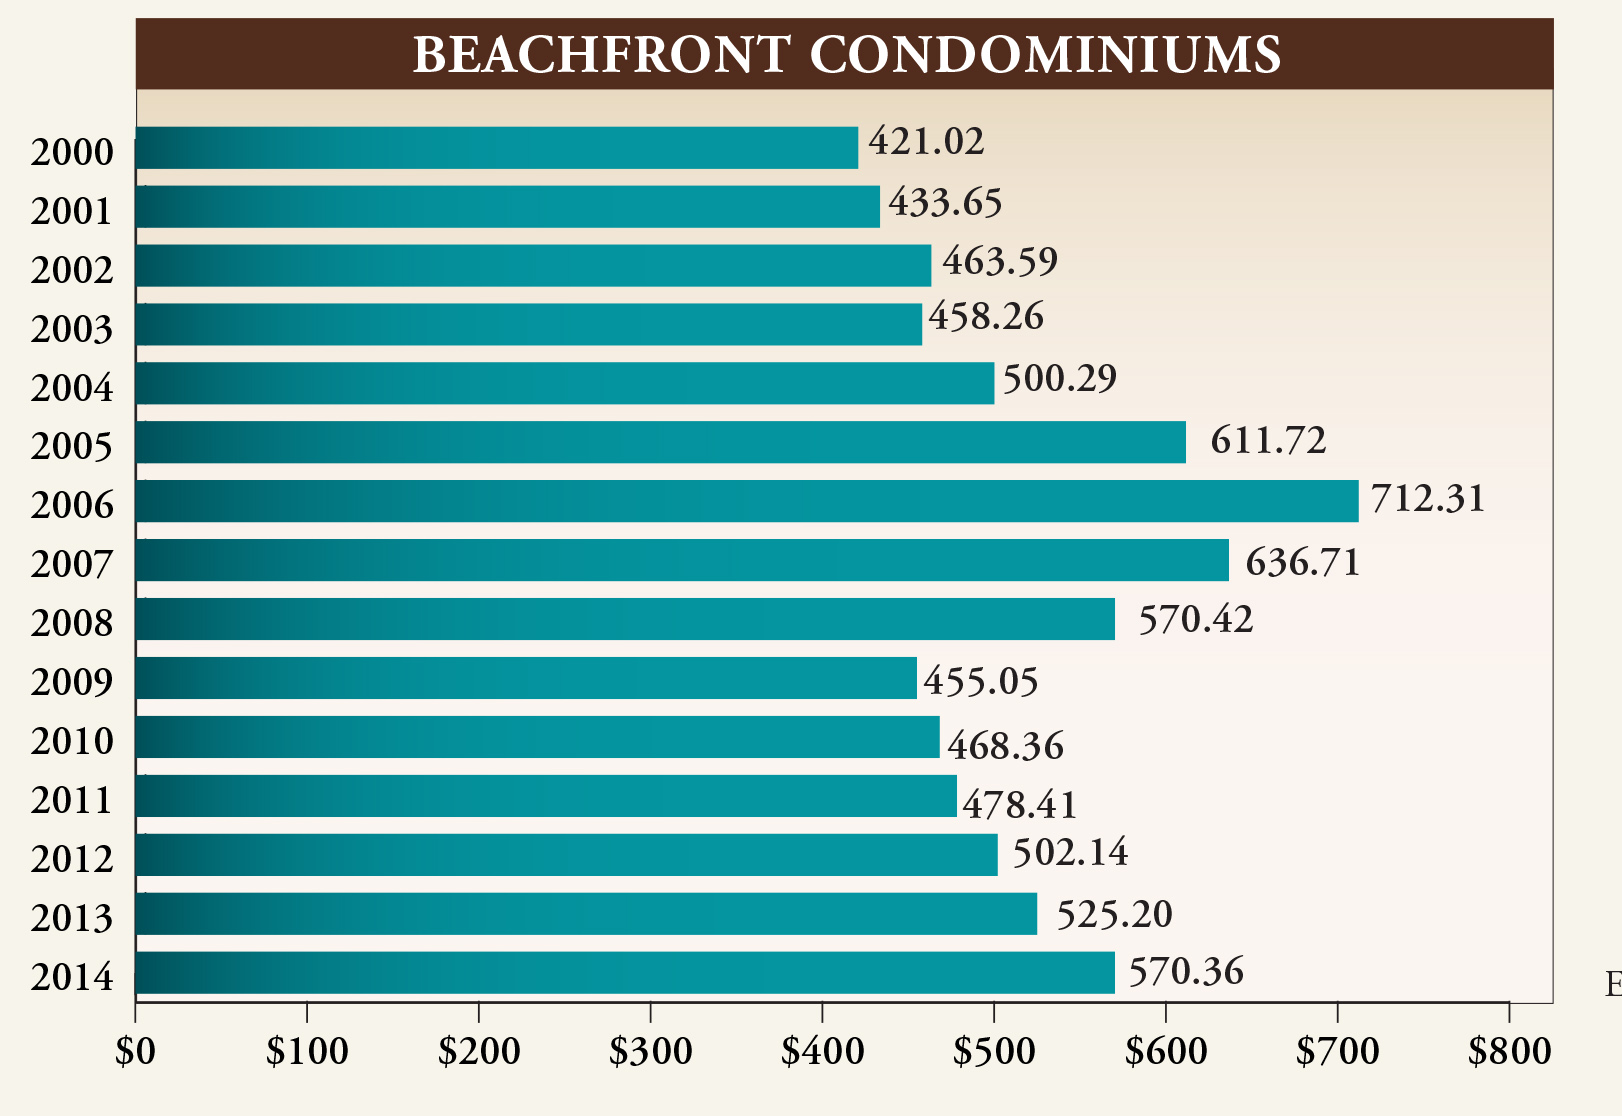
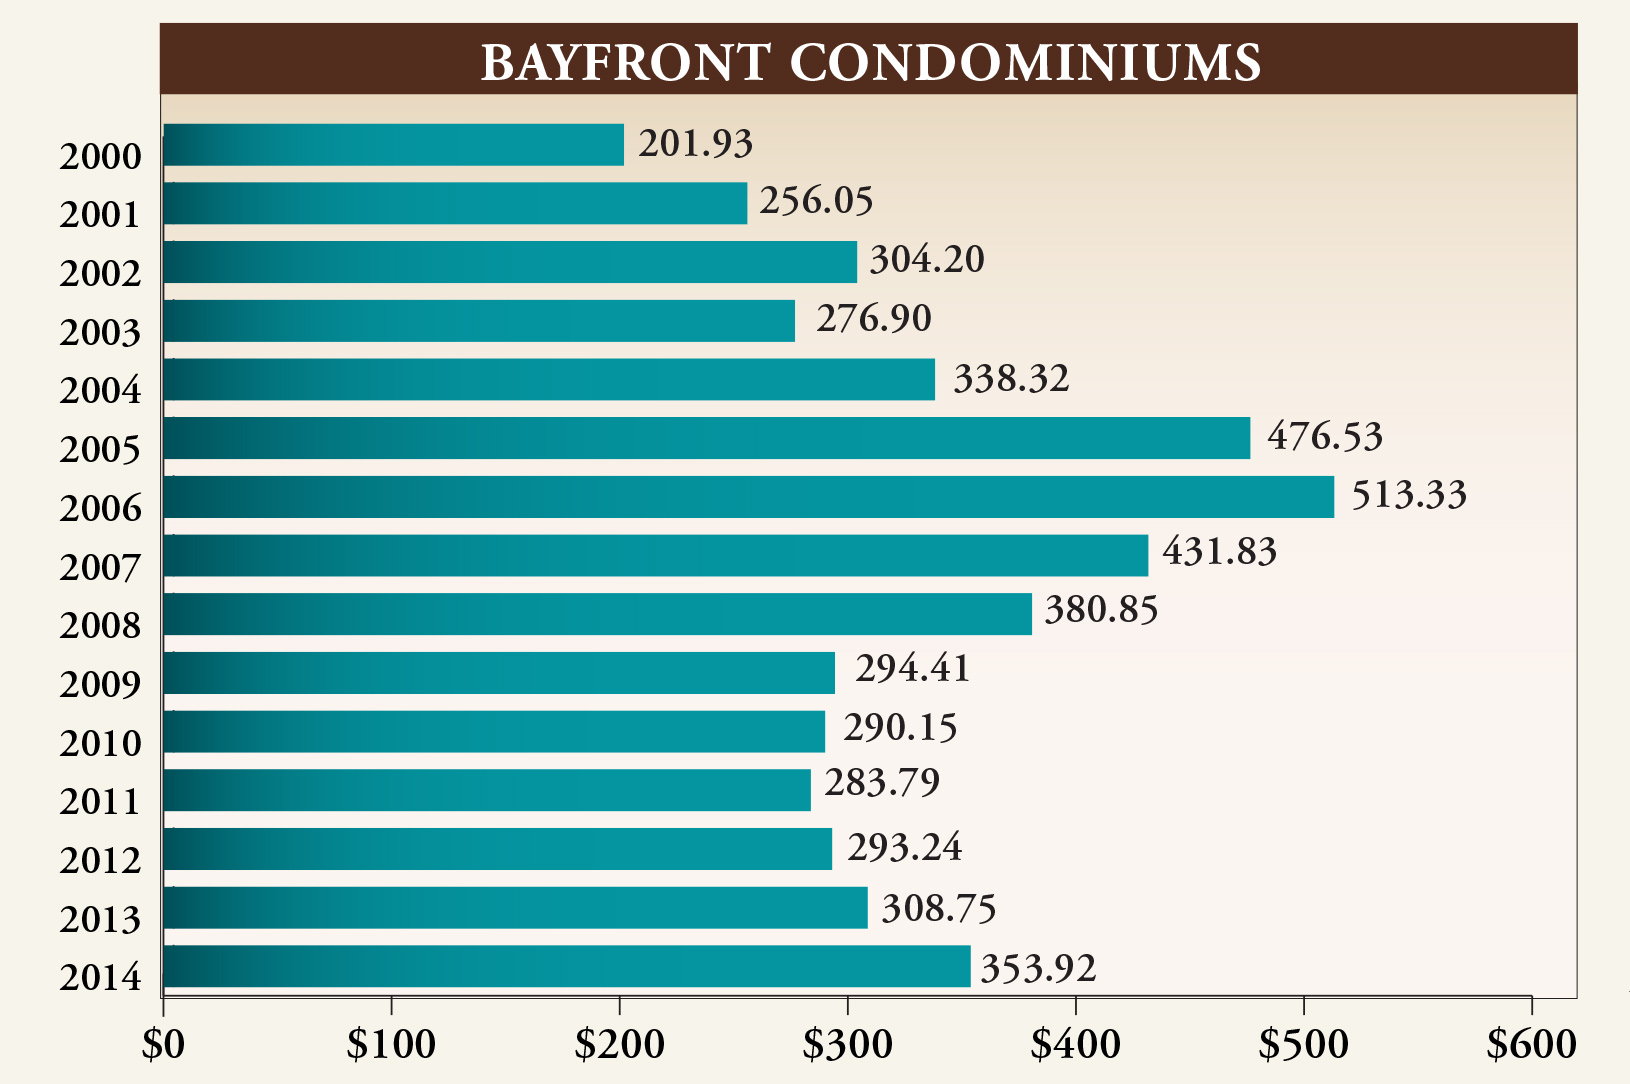
ANNUAL AVERAGE PRICE PER SQUARE FOOT – CLOSED SALES
During the second quarter, the average price per square foot for properties on the bay increased 15% and the beach increased 9% from 2013. As with average sales price, average price per square foot is impacted by the increased number of higher priced sales in each market.
The actual prices paid per square foot, by building, range from $221 to $585 per square foot on the bay and from $275 to $977 on the beach. (Exhibits 3a & 3b)
SUMMARY
During the first half of 2014, the beachfront market on Gulf Shore Boulevard remained strong, with an increase in sales volume and prices and a stabilizing number of sales. Average sales price is up over prior year, but remains 29% below the high set for the period in 2006.
Inventory once again declined on Gulf Shore Boulevard, down 27% on the beach (115 to 84 units) and 24% on the bay (29 to 22 units). This represents a 4.5 month supply on the beach and a 3.8 month supply on the bay.
This report is intended to give a broad view of market activity and trends among waterfront condominiums on Gulf Shore Boulevard. Please contact Dustin on any property in which there is specific interest.
“The source of this real property information is the copyrighted and proprietary database compilation of Southwest Florida MLS. Copyright 2014 Southwest Florida MLS. All rights reserved. The accuracy of this information is not warranted or guaranteed. This information should be independently verified if any person intends to engage in a transaction in reliance upon it.”